Break-Even Point Explained: Step-by-Step Guide with Formulas, Examples, and Profit Planning Strategies
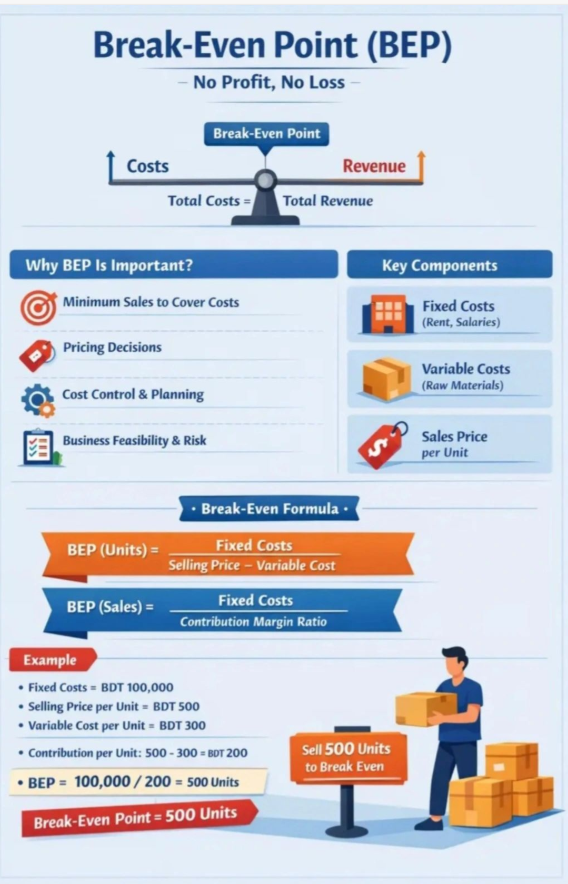
The break-even point (BEP) is one of the most important concepts in cost accounting. It tells a business exactly how much it must sell to cover all its costs without making a profit or a loss. Understanding this concept helps managers make pricing, budgeting, and investment decisions with confidence.
Step 1: Understand the Cost Structure
Before calculating the break-even point, we must clearly separate costs into fixed and variable categories.
Fixed costs are expenses that do not change with production levels. These include rent, salaries, insurance, and depreciation. For example, if a company pays $30,000 in annual rent, that amount remains the same whether it produces 1 unit or 10,000 units.
Variable costs change directly with production. Examples include raw materials, packaging, and direct labor. If it costs $20 in materials to produce one unit, producing 100 units will cost $2,000 in materials.
Accurate classification is the foundation of correct break-even analysis.
Step 2: Calculate Contribution Margin
The contribution margin shows how much each unit contributes toward covering fixed costs and generating profit.
Contribution Margin per Unit = Selling Price per Unit – Variable Cost per Unit
Example:
Selling price = $80
Variable cost = $50
Contribution margin per unit = $30
This means every unit sold contributes $30 toward covering fixed costs.
We can also calculate the contribution margin ratio:
Contribution Margin Ratio = Contribution Margin ÷ Selling Price
Using the same example:
30 ÷ 80 = 0.375 or 37.5%
This means 37.5% of each sales dollar contributes toward fixed costs and profit.
Step 3: Calculate Break-Even Point in Units
Break-Even Units = Fixed Costs ÷ Contribution Margin per Unit
Assume fixed costs are $60,000 and contribution margin per unit is $30.
Break-even units = 60,000 ÷ 30 = 2,000 units
The company must sell 2,000 units to break even.
Step 4: Calculate Break-Even Point in Sales Dollars
Break-Even Sales = Fixed Costs ÷ Contribution Margin Ratio
Using the same data:
60,000 ÷ 0.375 = $160,000
This means the business must generate $160,000 in sales revenue to break even.
Step 5: Analyze Target Profit
Break-even analysis can also be extended to calculate sales needed for a target profit.
Required Units = (Fixed Costs + Target Profit) ÷ Contribution Margin
If the company wants to earn $30,000 profit:
(60,000 + 30,000) ÷ 30 = 3,000 units
To earn $30,000, the company must sell 3,000 units.
Step 6: Understand Margin of Safety
Margin of Safety shows how much sales can drop before the business incurs a loss.
Margin of Safety = Actual Sales – Break-Even Sales
If actual sales are $200,000 and break-even sales are $160,000:
Margin of Safety = $40,000
This indicates a safety cushion before losses begin.
Final Thoughts
Break-even analysis is not just a formula; it is a strategic decision-making tool. It helps businesses evaluate pricing strategies, control costs, assess risk levels, and set realistic financial goals. When properly applied, it provides clarity and strengthens financial planning in cost accounting.